


Learning how to read a histogram will help you get much better exposure and tonal range in your images
A histogram is one of the most useful tools for photographers. Even if you don’t know what a histogram is or how to read one, the chances are that you have seen one on the LCD screen of your camera or in image editing software. This guide will give you all the basics that you need to know about histograms and how to use them for your photography.

What is a histogram in photography?
A histogram in photography terms is simply a graphical way of showing the tonal range and values of an image.
Think of it as the science behind the photo. Every image comprises of millions of pixels, and the histogram shows these as a graph.
The graph ranges from pure black on the left-hand side and progressively gets lighter until you reach the right-hand side, which is pure white. The middle part of the graph is for what is known as mid-tones. The higher each point of the graph, the more of that particular brightness (in terms of pixel count) exists in the image.
As you might have guessed, this means that the histogram is related to exposure. The brighter an image, the more the graph shifts to the right. The darker the image, the more the graph shifts to the left.
Cameras and editing software will also often display a colour histogram. The principle is still the same - only this time the histogram shows the three RGB colours of red, green and blue.

How can you use a histogram for my photography?
You might be thinking; that’s great, but why do I need to use it for my photography
Firstly, because you shouldn’t just rely on viewing an image on your LCD screen on the back of the camera, this can be unreliable because of the reduced size of the image you are viewing. Also, if you are looking at a photo in bright sunshine, this can sometimes make a photo seem too dark on the screen, when in fact it’s well exposed.
A histogram on your DLSR allows you to see the exact tones of your exposures, so you can correct any issues there and then.
One of the biggest issues that it can help you avoid is a term known as “clipping” or “clipped”. This occurs in parts of your image which are pure white or pure black and results in no pixel detail whatsoever. This is always undesirable in photography and will affect the overall quality of your image.
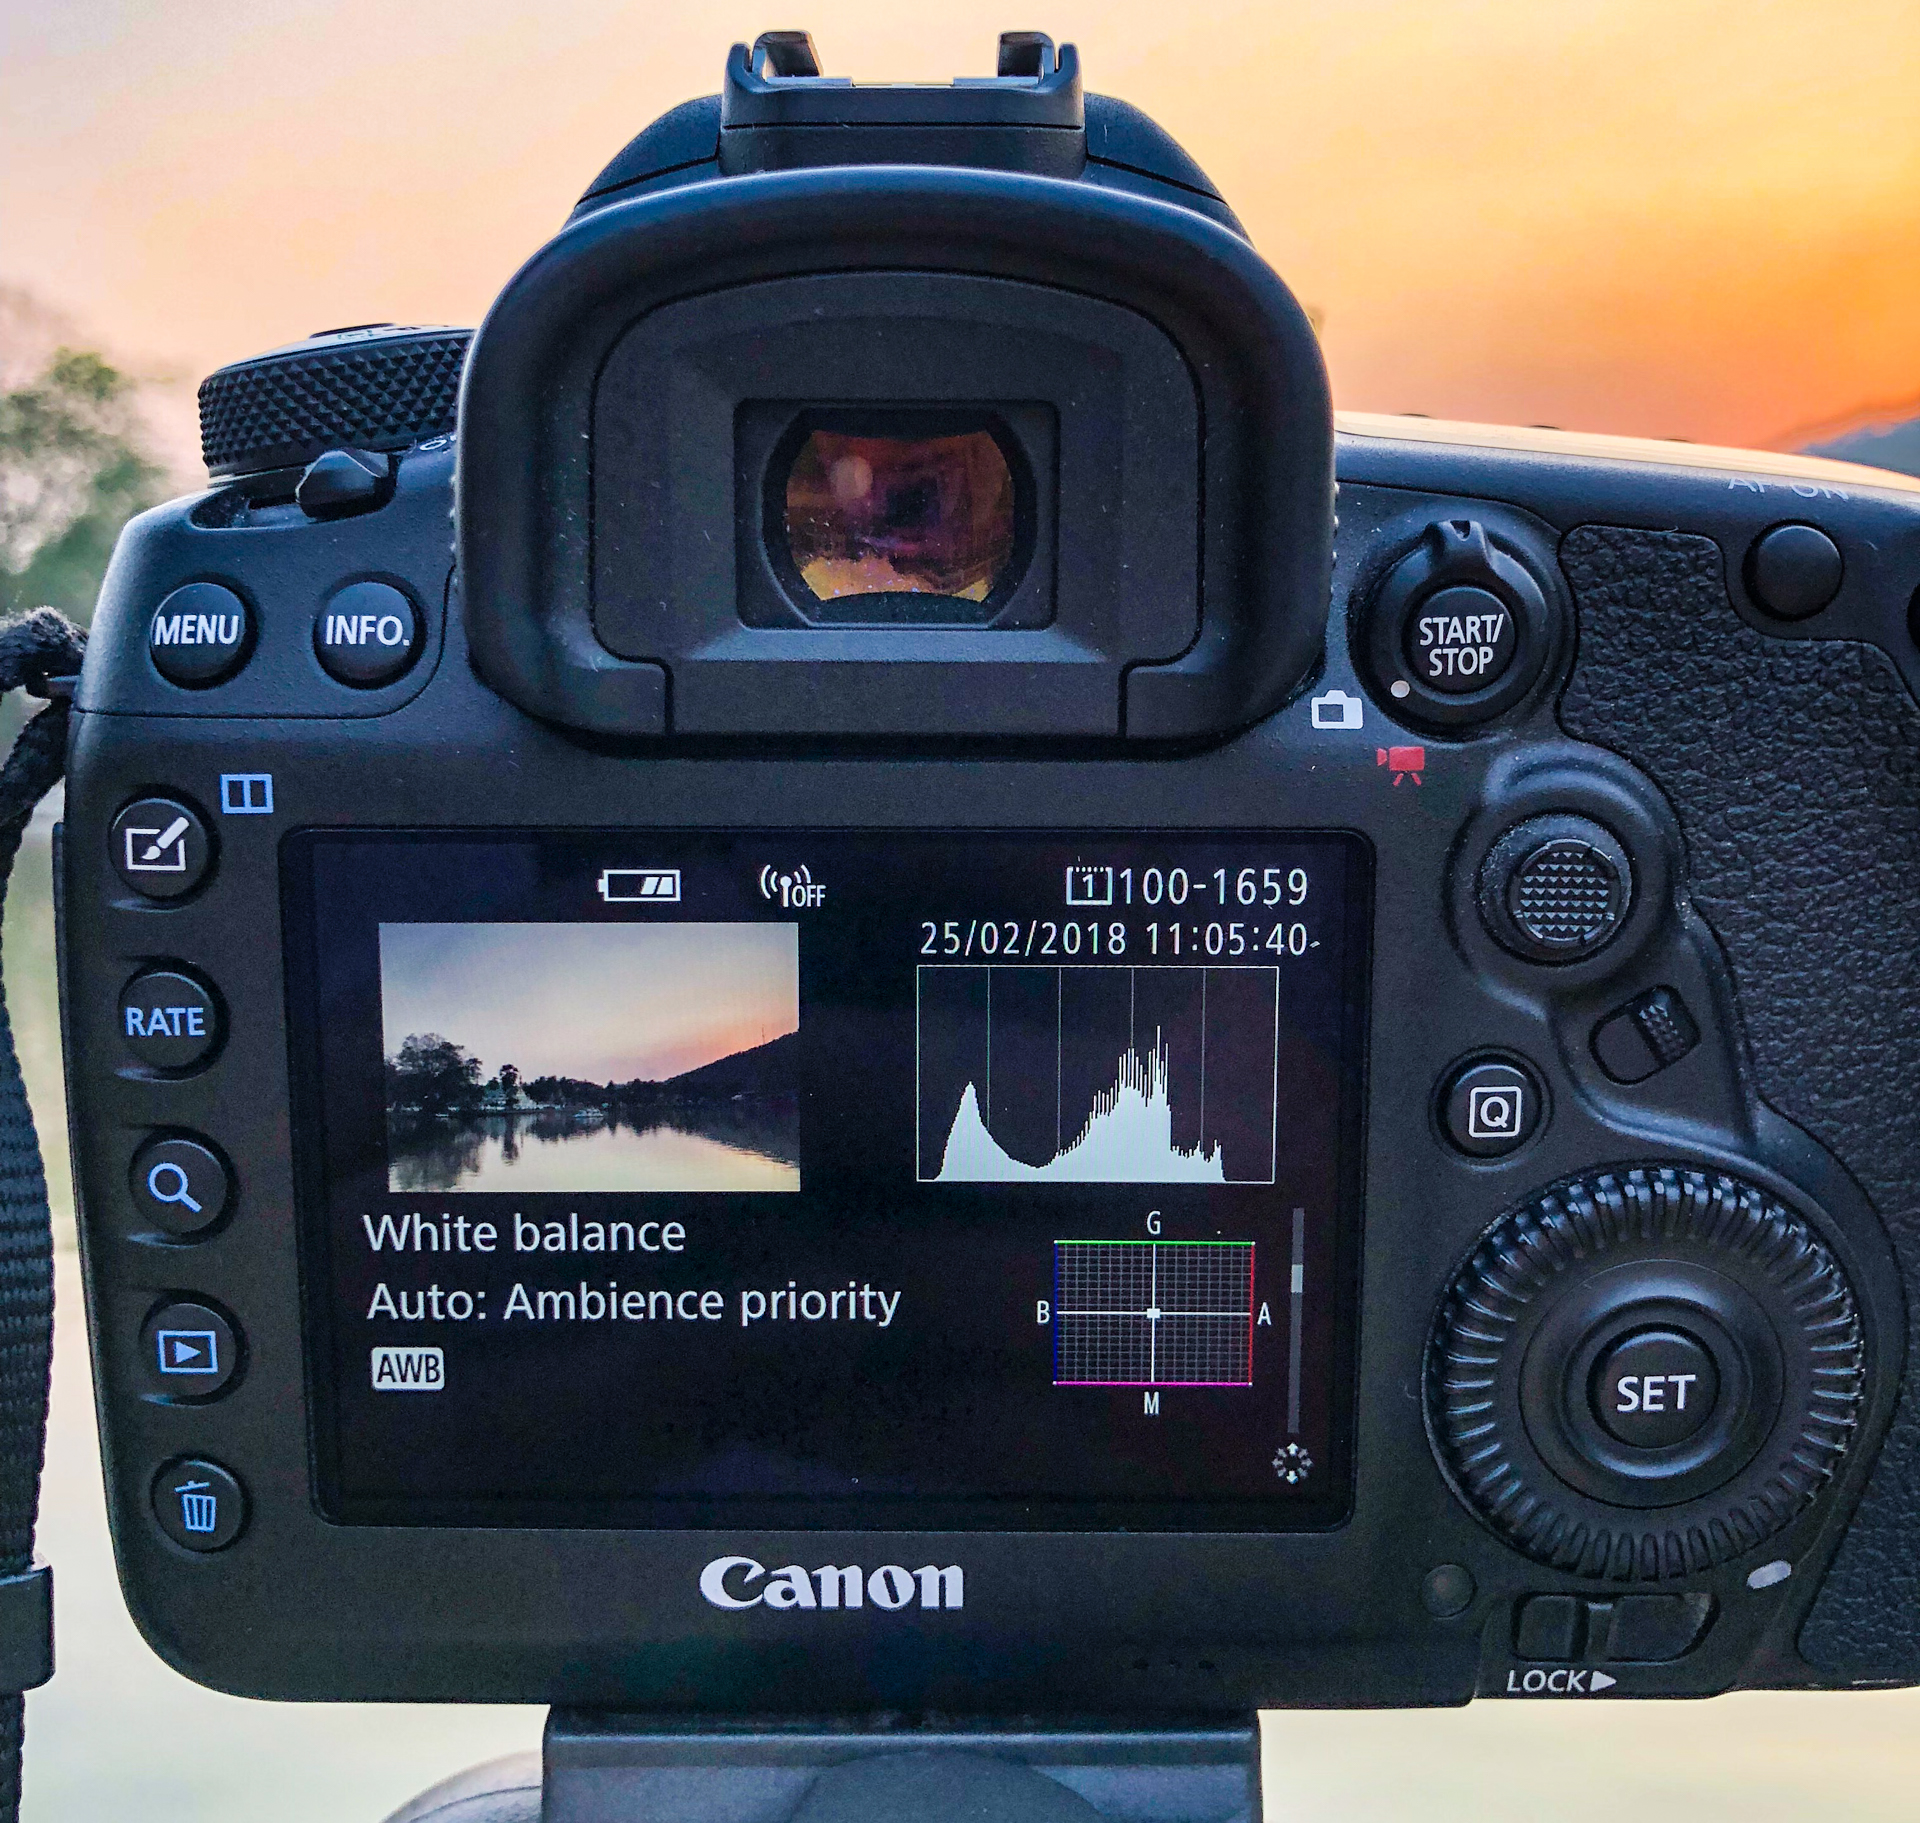
Clipping can be hard to spot just by looking at a small photo on the LCD screen of your camera. This is where a histogram is useful.

As shown, it can be difficult to know where clipped areas are in a small photo when viewed on the camera’s LCD screen
When looking at a histogram - if you see the graph in your image cut off by the left-hand axis, then your blacks or shadows are clipped. If you see the right-hand side of your graph cut off at the axis, then your highlights or whites are clipped.
The two images below (as seen in post-production) show how the histogram is cut off the axis on either side - indicating the clipped areas in the photo.
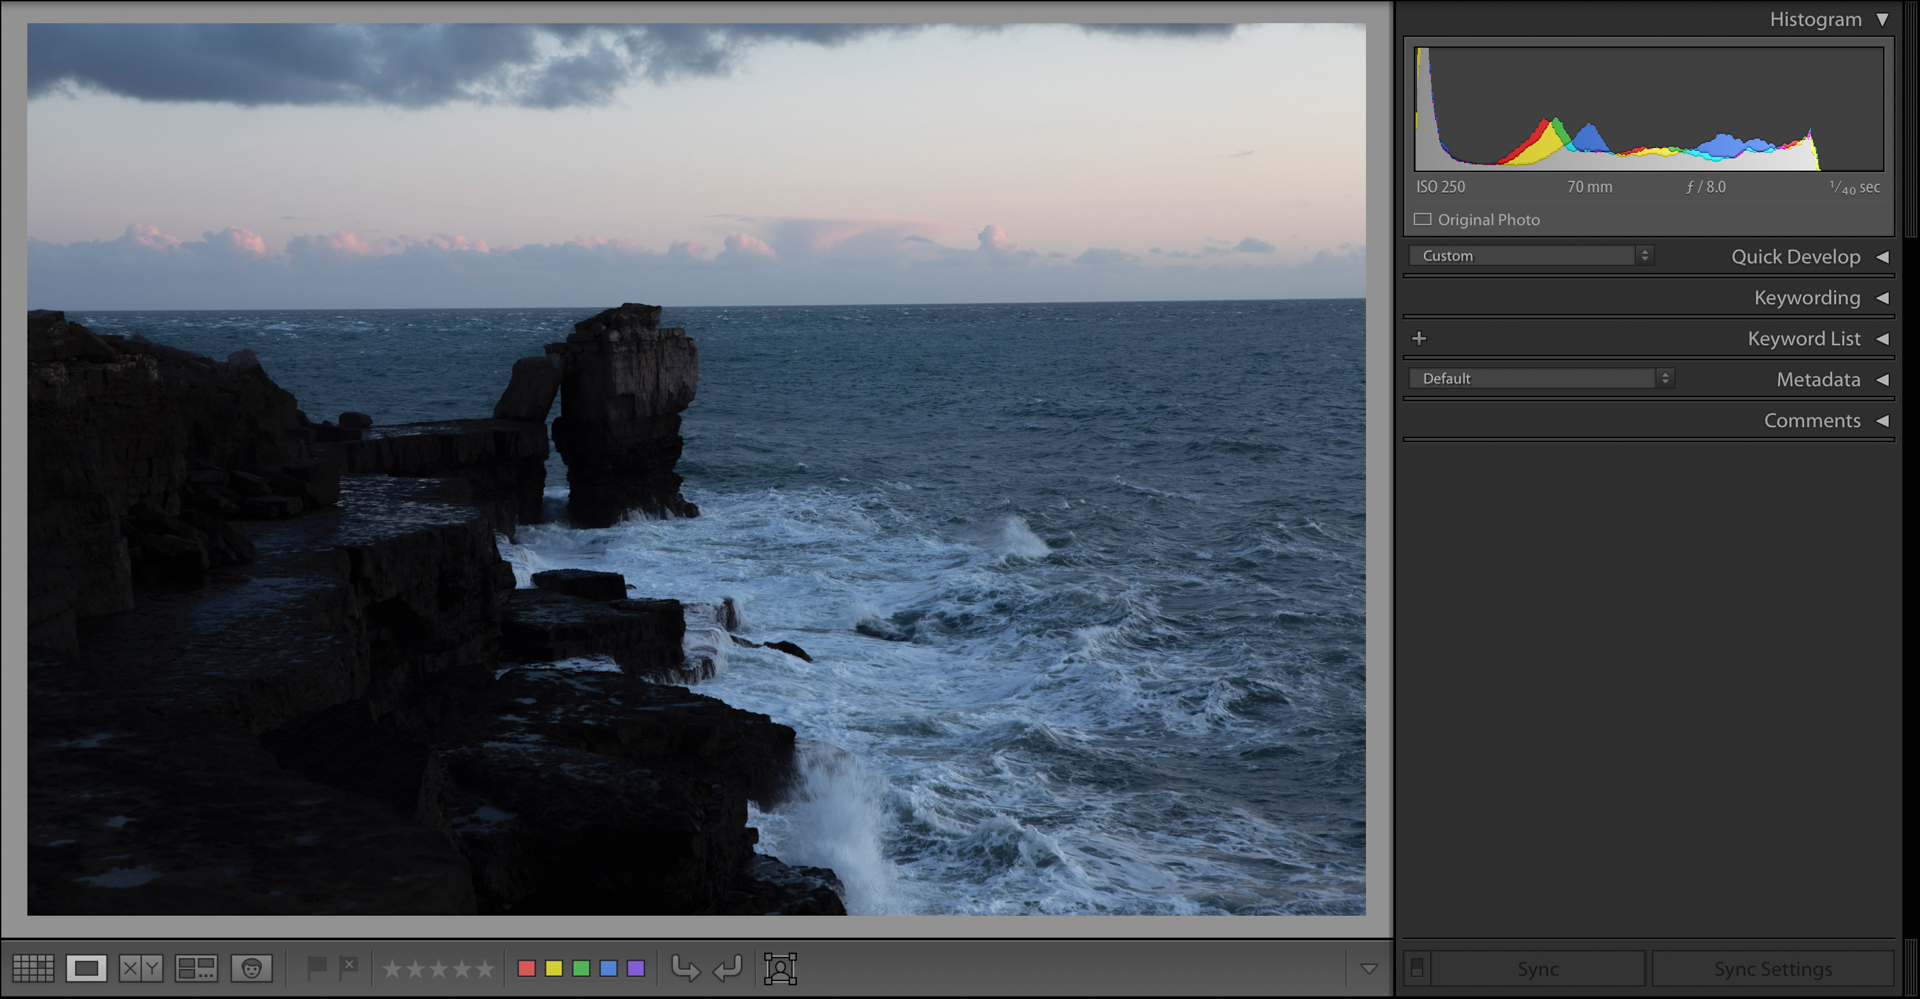
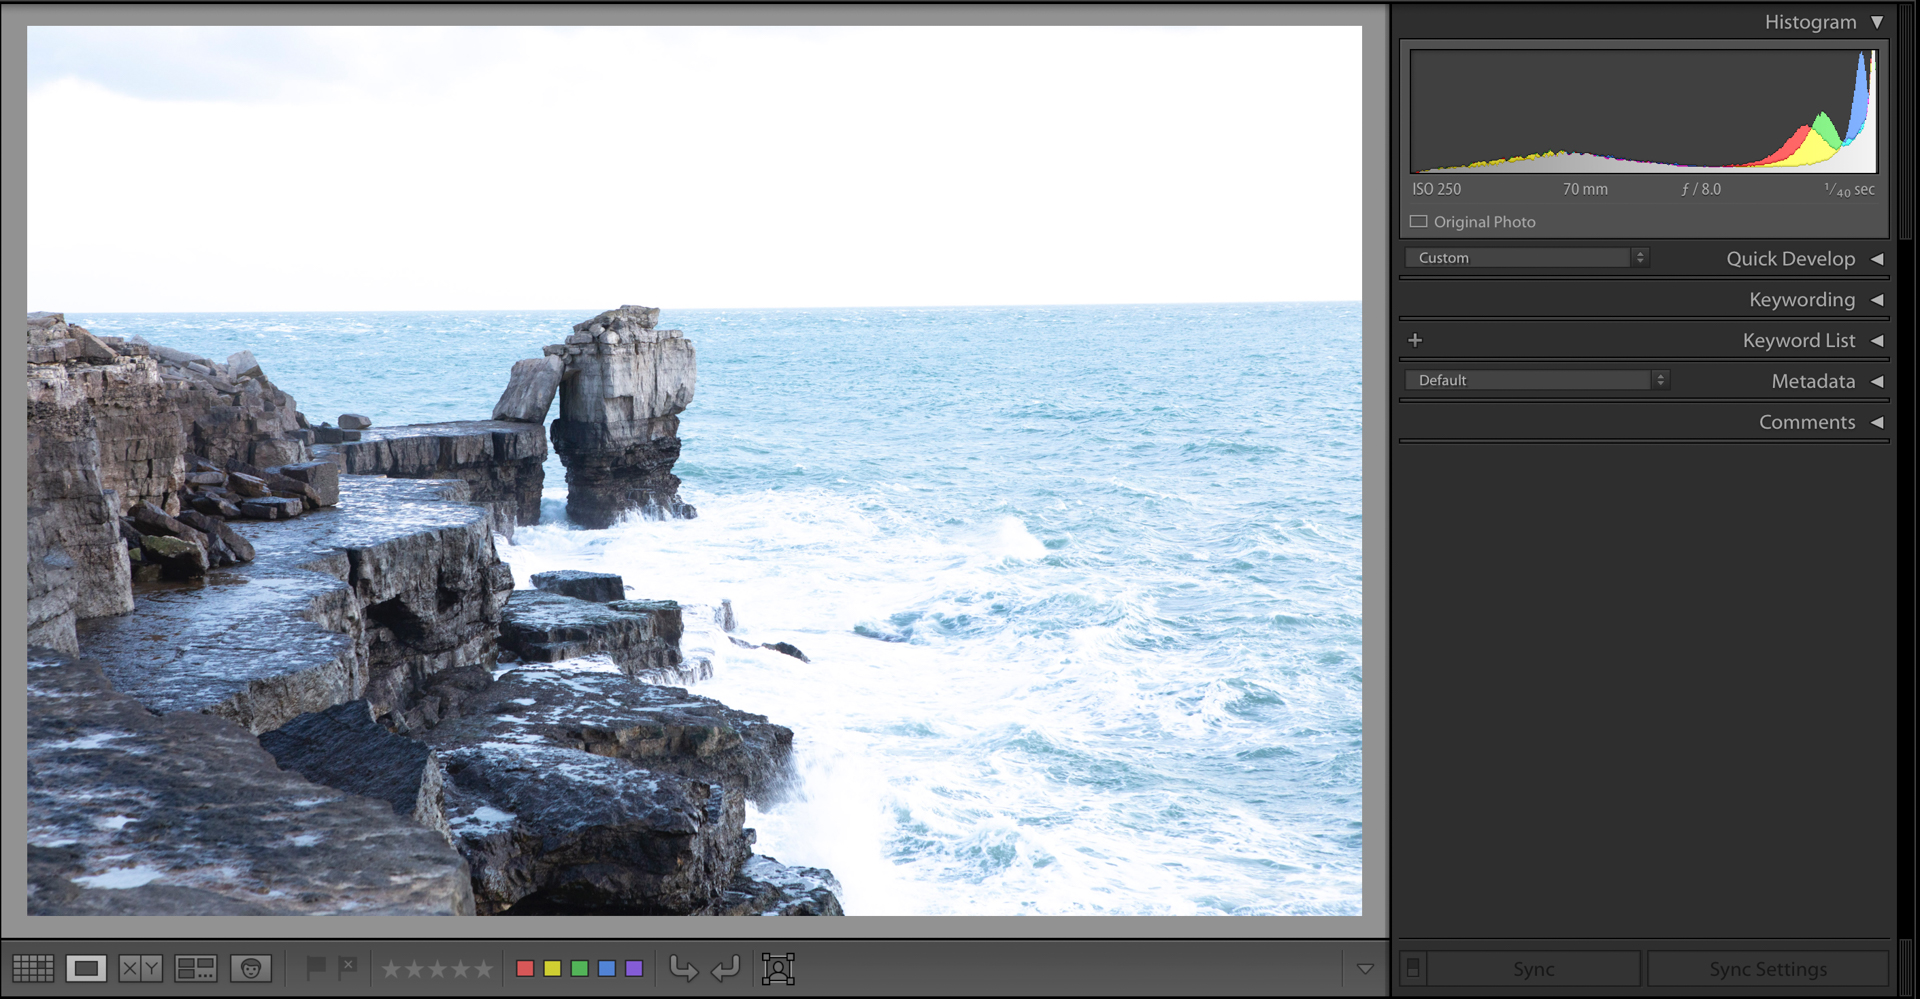
Being able to see this when you are taking photos allows you to adjust your exposure settings to combat this issue, without needing to make too many alterations in post-production.
For example, you could underexpose your shot a little bit to ensure your whites don't end up clipped, and then brighten the dark areas in post-production. Keep in mind that as advanced as editing software is, recovering detail from clipped areas, in extreme cases, won't be possible.
So it is a good idea to get a photo exposed as correctly as possible at the time of taking it.
How to use the histogram in post-production
The camera histogram is a great way to ensure your photos are correctly exposed. But every photo will still benefit from some level of post-processing - especially if you shoot in RAW files (which you absolutely should do if your camera allows it).
When you come to edit your photo, try to use the histogram as a guide to ensure you have a good tonal range in your image and try to fix any clipped areas.
Tip:
Lightroom has a handy function that highlights areas of your image that are clipped, so that you can view these areas live as you make adjustments.
In the “Develop” module, click on the two small arrows on the top right and left-hand side of the image. If any parts of your image have highlights clipped - you'll see a red overlay shown on your image.
If there are any clipped dark areas, you'll see a blue overlay on your image.
Use the sliders to the right of the image Highlights, Shadows, Whites, Blacks, to adjust the highlights and shadows.

What is a good histogram?
This is one of the most common questions asked. A lot of photographers out there would say that a good histogram is one where most of the tones are in the middle part of the image.
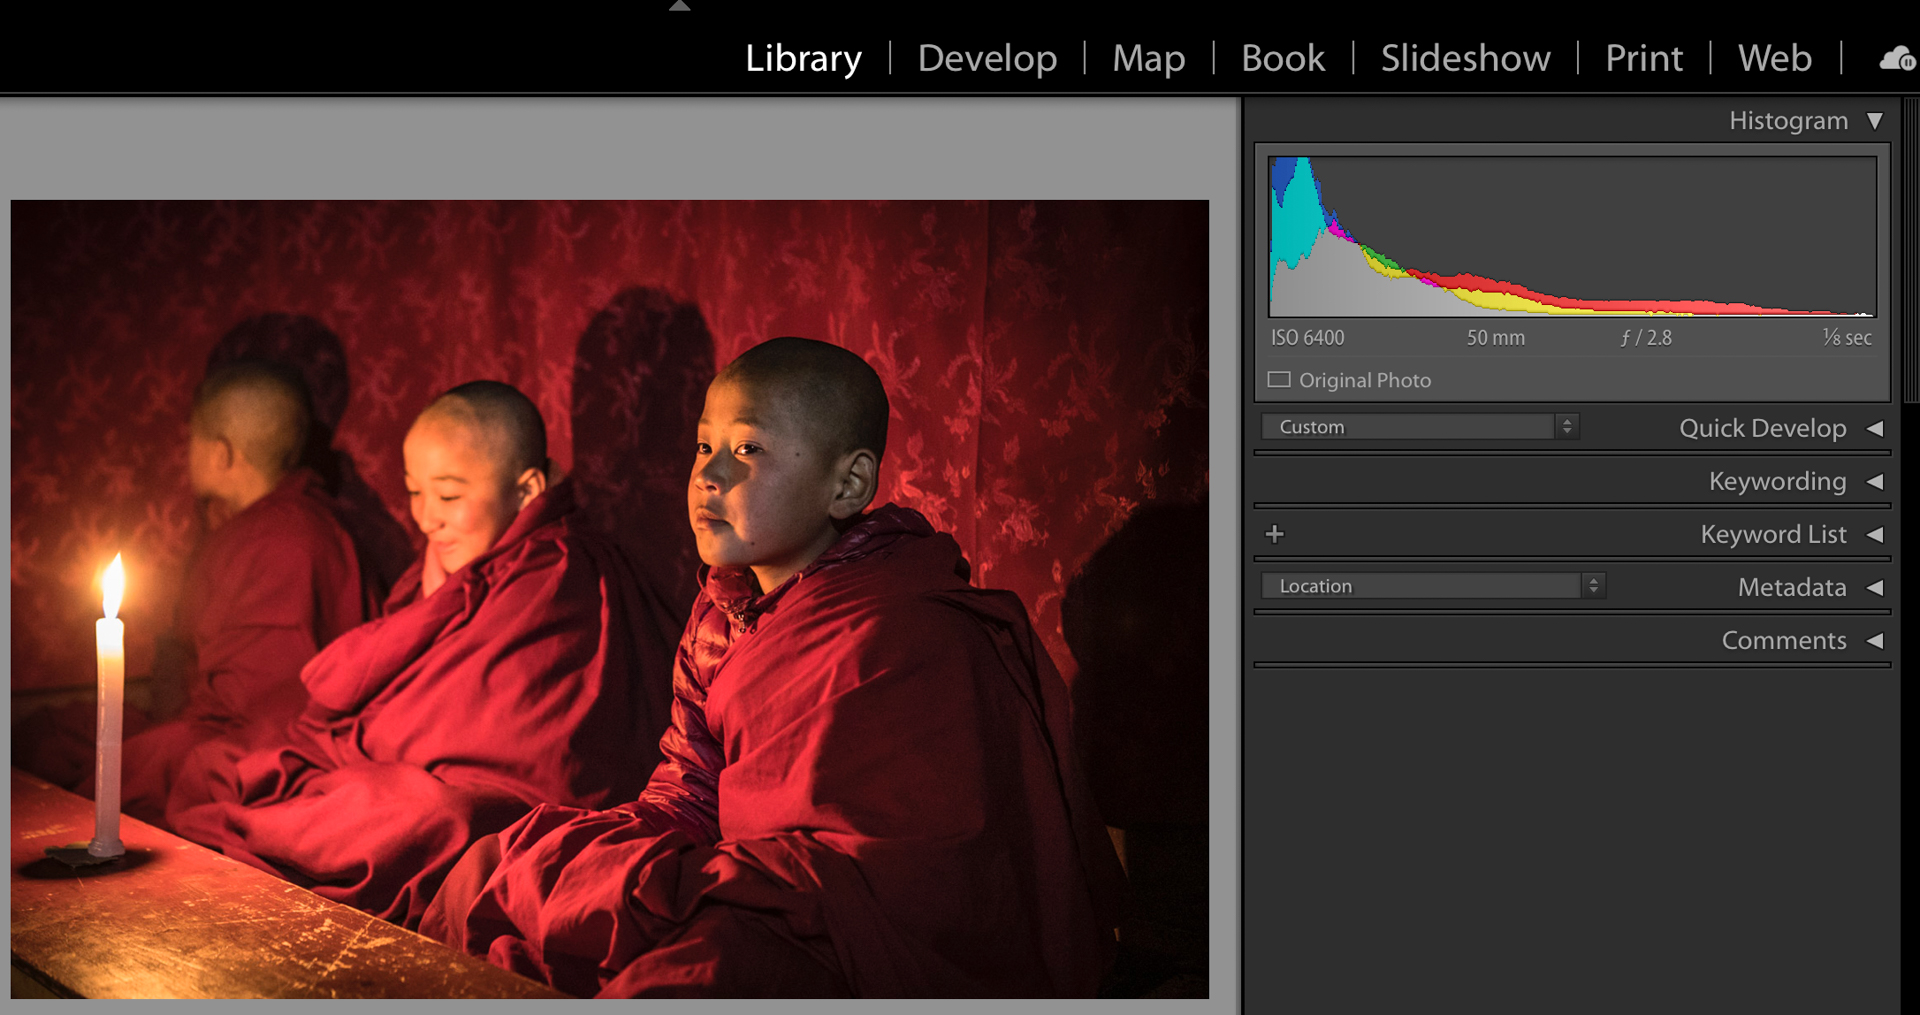
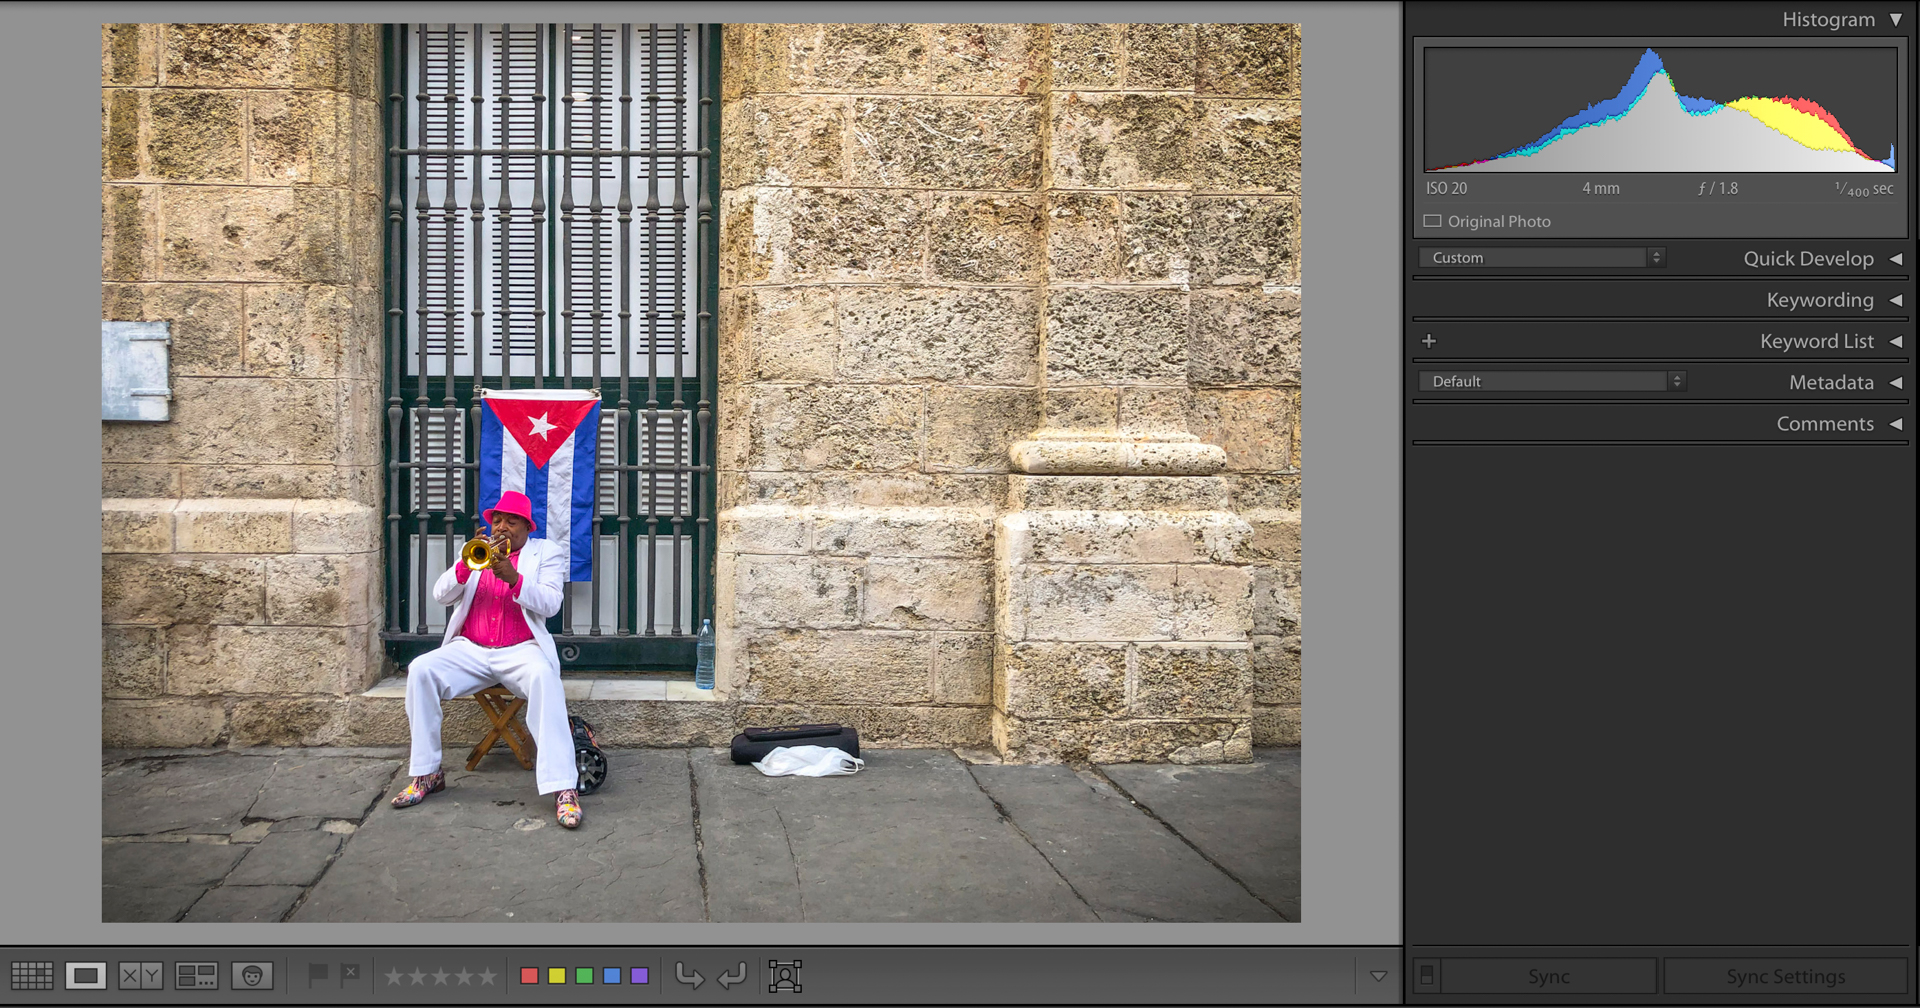
But photography isn’t quite as black and white as that theory. For example, you can have an image where you deliberately want to have darker areas to heighten the mood in the image. Or you may have an image where your colours are predominantly white (like someone in a wedding dress standing in front of a light-coloured wall). So naturally, your histogram is going to reflect this, and will show on either extreme of the graph.
Situations like this doesn’t mean the photo isn’t exposed correctly and needs to be darkened. It is simply down to the scene you are photographing.
This example shows how the theory of the histogram being in the center doesn’t always work...
How to aim for a good tonal range
For most scenarios, your aim should be to capture a photo where your histogram stretches across the graph (or even slightly to the right – a term known as “exposing to the right”) as this will give you a good dynamic range in your image. You can then adjust the exposure in post-production and pull it back a little if needs be.
If you find yourself in a scenario where you do have to compensate at either side of your graph to avoid clipping, you are far better off underexposing and trying to recover shadows than trying to recover highlights.
The main thing to remember is not to get caught up in whether your histogram is good or bad but instead try to use it as a guide for your photos.
Next steps
How much you use your histogram will ultimately come down to you.
I look at the histogram on my camera often. Indeed, more than I look at the actual photos I have taken as it gives me far more information. And If you can get into the habit of checking it regularly - you'll find that it will make a significant impact on the quality of your exposures.
All images by Kav Dadfar unless otherwise stated.

Kav is a full-time photographer and author of 400+ articles. He is also a judge on the Wanderlust Magazine Photography of the Year competition and leads small group photo tours around the world.
View all articles

